Revenue in financial reporting
What is Revenue?
Revenue is the value of all sales of goods and services recognized by a company in a period. Revenue (also referred to as Sales or Income) forms the beginning of a company’s Income Statement and is often considered the “Top Line” of a business. Expenses are deducted from a company’s revenue to arrive at its Profit or Net Income.
Revenue Recognition Principle
According to the revenue recognition principle in accounting, revenue is recorded when the benefits and risks of ownership have transferred from seller to buyer, or when the delivery of services has been completed.
Notice that this definition doesn’t include anything about payment for goods/services actually being received. This is because companies often sell their products on credit to customers, meaning that they won’t receive payment until later.
When goods or services are sold on credit, they are recorded as revenue, but since cash payment is not received yet, the value is also recorded on the balance sheet as accounts receivable.
When cash payment is finally received later, there is no additional income recorded, but the cash balance goes up, and accounts receivable goes down.
Revenue Example
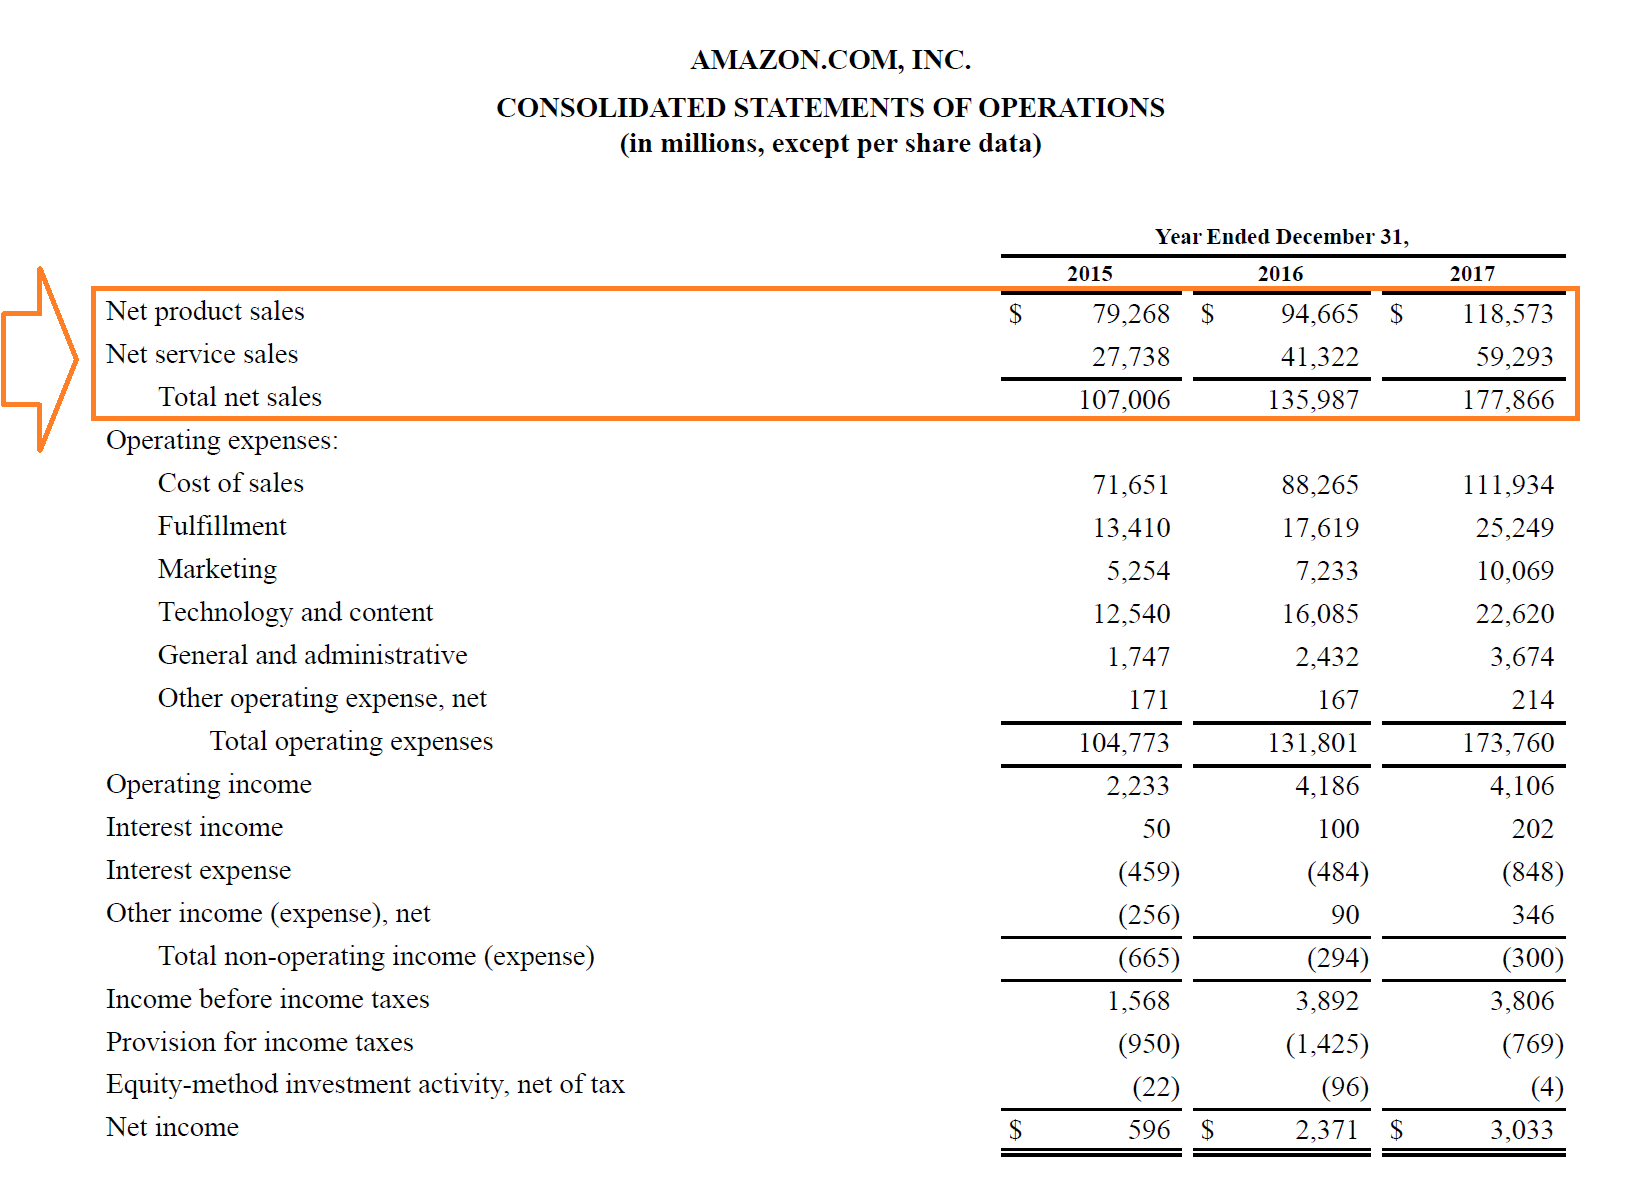
Below is an example of Amazon’s 2017 income statement. Let’s take a closer look to understand how revenue works for a very large public company.
Amazon refers to its revenue as “sales,” which is equally as common as a term. It reports sales in two categories, products and services, which then combine to form total net sales.

In 2017, Amazon recorded $118.6 billion of product sales and $59.3 billion of service sales, for a grand total of $178.9 billion. The figure forms the top line of the income statement.
Beneath that are all operating expenses, which are deducted to arrive at Operating Income, also sometimes referred to as Earnings Before Interest and Taxes (EBIT).
Finally, interest and taxes are deducted to reach the bottom line of the income statement, $3.0 billion of net income.
Revenue Formula
The revenue formula may be simple or complicated, depending on the business. For product sales, it is calculated by taking the average price at which goods are sold and multiplying it by the total number of products sold. For service companies, it is calculated as the value of all service contracts, or by the number of customers multiplied by the average price of services.
Revenue = No. of Units Sold x Average Price
or
Revenue = No. of Customers x Average Price of Services
The formulas above can be significantly expanded to include more detail. For example, many companies will model their revenue forecast all the way down to the individual product level or individual customer level.
Revenue Forecast
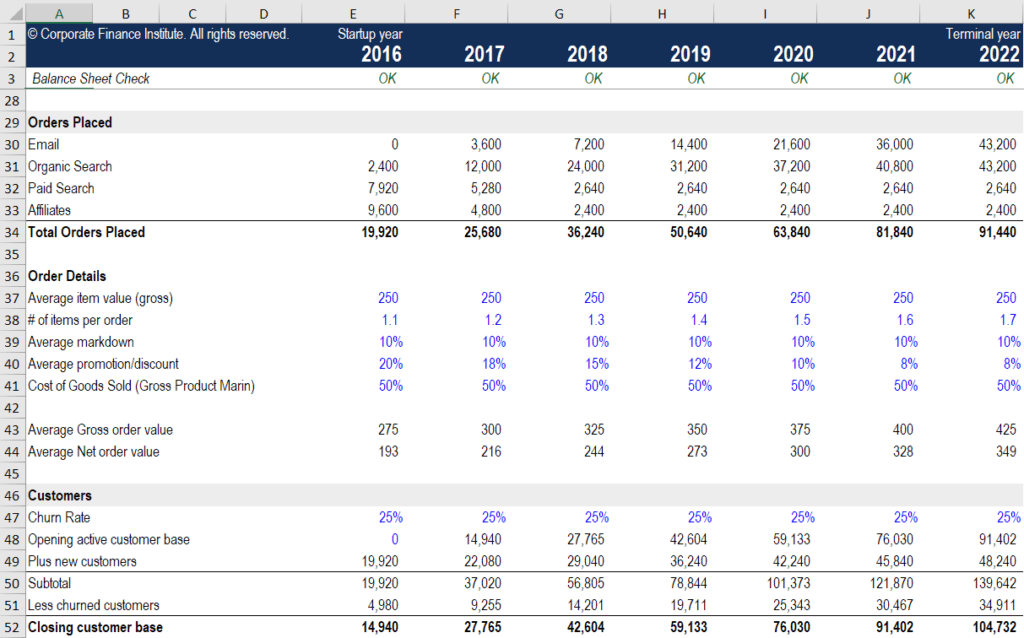
Below is an example of a company’s forecast based on many drivers, including:
- Website traffic
- Conversion rates
- Product prices
- Volume of different products
- Discounts
- Return and refunds

As you can see in the example above, there is much more that can be included in a forecast other than just No. of Units x Average Price.
CFI’s e-Commerce Financial Modeling Course provides a detailed breakdown of how to build this type of model, which is extremely important for forecasting and business valuation.
Revenue on the Income Statement (and other financials)
Sales are the lifeblood of a company, as it’s what allows the company to pay its employees, purchase inventory, pay suppliers, invest in research and development, build new property, plant, and equipment (PP&E), and be self-sustaining.
If a company doesn’t have sufficient revenue to cover the above items, it will need to use an existing cash balance on its balance sheet. The cash can come from financing, meaning that the company borrowed the money (in the case of debt), or raised it (in the case of equity).
In order to perform a comprehensive analysis of a business, it’s important to know how the 3 financial statements are linked and see how a company either uses its sales to fund the business or must turn to financing alternatives to fund the business.
Recognition of revenue
Recogntion as defined in the IASB framework means incorporating an item that meets the definition of revenue in the income statement if it meets the following criteria:
a. It is probable that any future economic benefit associated with the item of revenue will flow to the entity
b. the amount of revenue can be measured with reliability
Recognition, as defined in the IASB Framework, means incorporating an item that meets the definition of revenue (above) in the income statement when it meets the following criteria:
- it is probable that any future economic benefit associated with the item of revenue will flow to the entity, and
- the amount of revenue can be measured with reliability
- it is probable that any future economic benefit associated with the item of revenue will flow to the entity, and
- the amount of revenue can be measured with reliability
IAS 18 provides guidance for recognising the following specific categories of revenue:
IAS 18 provides guidance for recognising the following specific categories of revenue:Revenue in Different Sectors
Below, we will explore what the concept of revenue means in different sectors. As you will see, it can be composed of many different things and varies widely in terms of what the most common examples are, by sector.
Personal finance:
- Salaries
- Bonuses
- Hourly wages
- Dividends
- Interest
- Rental income
Public finance:
- Income tax
- Corporate tax
- Sales tax
- Duties and tariffs
Corporate finance:
- Sale of goods
- Sales of services
- Dividends
- Interest
Non-profits:
- Membership Dues
- Fundraising
- Sponsorships
- Product/service sales
The three main areas that typically make up the finance industry are public finance, personal finance, and corporate finance. As we demonstrated above, the various sources of income in each type can be quite different. While the above lists are not exhaustive, they do provide a general sense of the most common types of income you’ll encounter.
Revenue
- Sales of goods or services: This account tracks the company’s revenues for the sale of its products or services.
- Sales discounts: This account tracks any discounts the company offers to increase its sales. If a company is heavily discounting its products, either it may be competing intensely or interest in the product may be falling. A company outsider probably doesn’t see these numbers, but if you’re reading the reports prepared for internal management, this account gives you a view of how discounting is used.
- Sales returns and allowances: This account tracks problem sales from unhappy customers. A large number here may reflect customer dissatisfaction, which could be the result of a quality-control problem. A company outsider probably doesn’t see these numbers, but internal management financial reports show this information. A dramatic increase in this number is usually a red flag for company management.
Cost of goods sold
- Purchases: This account tracks the cost of merchandise a company buys. A manufacturing company has an extensive tracking system for its cost of goods that includes accounts for items like raw materials, components, and labor to produce the final product.
- Purchase discounts: This account tracks any cost savings a company is able to negotiate because of accelerated payment plans or volume buying. For example, if a vendor offers a 2 percent discount when a customer pays an invoice within 10 days rather than the normal 30 days, the vendor tracks this cost saving in purchase discounts.
- Purchase returns and allowances: This account tracks any transactions involving the return of any damaged or defective products to the manufacturer or vendor.
- Freight charges: This account tracks the costs of shipping the goods sold.

Comments
Post a Comment