Posts

Showing posts from 2014

More on Isocost

Image
     Home  >  The Production Process: The Behavior of...  >  Appendix: Isoquants and Isocosts  >       The Production Process: The Behavior of...  Appendix: Isoquants and Isocosts Isoquants allow us to show all of the various combinations of capital and labor that can be used to produce a level of output. For example, in the table below, 50 units of output can be produced with 1 unit of capital and 8 units of labor, or with 8 units of capital and 1 unit of labor. The two resources can be substituted for each other. We can do a similar analysis for 100 and 150 units of output. Graphing the data, we have the following: While the figure above shows only three isoquants, there are many more (one for each possible level of output). The slope of an isoquant represents the rate at which labor can be substituted for capital (reading down the isoquant from left to right, the amount of capital is decreasing and the amount of labor is increasing). This is shown in the figure

Isoquant and Isocost

I. Isoquant and Isocost (Theory of Production in the long term) II. Objective: Students will know: 1. Isoquant Curves 2. Isocost Curves 3. Cost minimization or Output maximization; Expansion Path III. Materials IV Procedure 1. Isoquant Curves Isoquant and Isocost curves are used for finding the best level of production in the long run, when all elements of production are variable, Labor (L) and Capital (K). Isoquant: A curve showing all possible combinations of inputs capable of producing a given level of output. Isoquants are convex producing a given level of output. Isoquants are convex to show there is an increasing cost to replace capital with labor (or replace labor with capital) The marginal product (MP) of labor decreases as it is used to replace capital. Marginal Rate of Technical Substitution (MRTS): The rate at which one input is substituted for another along an isoquant. MRTS = -∆K  ∆L (minus sign is added to make MRTS positive, since the slope o

Advertising and sales assignment for Sem V

Assignment to be submitted with examples in your own words. IT should not be a direct copy from books or Internet. In case it is found to be a copy zero will be awarded. Submit by mail. Last date is Thursday 25th September Meaning, nature and importance of advertising; 503 Types of advertising; 506 Advertising objectives and audience selection;512, 515 Setting of advertising budget. 519 Major media types - their merits and demerits; 528,531,536 print, a/v, ooh Factors influencing media choice.539 Advertising appeals, 542 Advertising copy and elements 545 Evaluating communication and sales effects 548 Pre and Post testing techniques. 551,555 Role, types and selection of advertising agency.559 Ethical and legal aspects of advertising.562 Nature and importance of personal selling; 566 Types of personal selling situations and selling jobs; 569,573 Personal selling and salesmanship; 576 Characteristics of a successful salesman;585 Customer knowledge –

Online Ad Market

Image
Online advertising market to touch over Rs 3,500 crore by March 2015 By PTI | 3 Sep, 2014, 04.27PM IST Post a Comment The online ad segment is expected to grow at a compounded annual growth rate of 25 per cent between FY'2011 to FY'2013. ET SPECIAL: ET Special: All you want to know about Apple iPhone 6 NEW DELHI: Rising marketing spend in sectors like e-Commerce, telecom,  FMCG  and consumer durables  will help the  online advertising  market in India, which is projected to grow at 30 per cent to touch Rs 3,575 crore by March 2015, a  IAMAI-IMRB  study today said.  According to the study, the online advertising market has grown from Rs 1,140 crore in 2010-11 to Rs 2,260 crore in 2012-13 and was estimated to be worth Rs 2,750 crore in 2013-14.  The online ad segment is expected to grow at a compounded annual growth rate of 25 per cent between FY'2011 to FY'2013.  The overall ad spend in the country across all media is Rs 38,598 crore as of 2013 w

Luxury Market

Image
Luxury players using cinema halls, TV, newpapers to target buyers By  Vijaya Rathore , ET Bureau | 18 Sep, 2014, 04.00AM IST Post a Comment Luxury players have started advertising through cinema halls and televisions. ET SPECIAL: ET Special: All you want to know about Apple iPhone 6 NEW DELHI: It is unusual for a top jewellery brand, which sells super expensive items such as a Rs 50-crore necklace through auctions, to put out advertisements in cinema halls for the popcorn-munching audience. But designer Nirav Modi's namesake jewellery label does exactly that recently.  "Be it someone who earns Rs 5,000 or Rs 5 crore a month, everyone watches films in India. It is a great way to reach out to a larger set of potential buyers," the designer reasons. "It is a great way to reach out to a larger set of potential buyers, but what you show and where has to be chosen wisely."  Modi is one of the numerous luxury players who have started using mass

Innovative campaign

Image
Innovative campaign: HUL gets Mumbai vendors to wrap bhelpuri in leaflets featuring Pepsodent ad By  Sagar Malviya , ET Bureau | 19 Sep, 2014, 04.00AM IST Post a Comment HUL has tied up with around 48 bhelpuri walas across Mumbai, asking them to wrap their popular roadside snack in leaflets of Pepsodent’s campaign. ET SPECIAL: ET Special: All you want to know about Apple iPhone 6 MUMBAI: When Vishal Thakkar bought four packets of  bhelpuri  from a roadside vendor in Mumbai late last month, they all came wrapped in similar green colour papers with children's drawings and messages about brushing teeth and fighting germs, bringing a smile to his face. Only when he found the same eye-catching design on the paper cone in his next 'chaat outing' did Thakkar realise it wasn't a coincidence.  It was part of a marketing campaign by  Hindustan Unilever  for its oral care brand Pepsodent. India's largest consumer products firm has tied up with around 4

practice questions micro economics

1.A survey indicated that chocolate is Americans’ favorite ice cream flavor. For each of the following, indicate the possible effects on demand, supply, or both as well as equilibrium price and quantity of chocolate ice cream. a. A severe drought in the Midwest causes dairy farmers to reduce the number of milk-producing cattle in their herds by a third. These dairy farmers supply cream that is used to manufacture chocolate ice cream. b. A new report by the American Medical Association reveals that chocolate does, in fact, have significant health benefits. c. The discovery of cheaper synthetic vanilla flavoring lowers the price of vanilla ice cream. d. New technology for mixing and freezing ice cream lowers manufacturers’ costs of producing chocolate ice cream. 2. Show in a diagram the effect on the demand curve, the supply curve, the equilibrium price, and the equilibrium quantity of each of the following events. a. The market for newspapers in your town Case 1: The salaries of jo

difference between inferior goods and giffen goods

Image
In economics, a giffen good is an inferior good with the unique characteristic that an increase in price actually increases the quantity of the good that is demanded.  This provides the unusual result of an upward sloping demand curve. This happens because of the interactions of the income and substitution effects.  Depending on whether the good is inferior or normal, the income effect can be positive or negative as the price of a good increases.  Imagine an inferior good being Top Ramen (an inexpensive noodle dish, common among students).  As your income rises, you actually consume less Top Ramen, because you may begin to buy more spaghetti, or steak, or something you enjoy more than Top Ramen.  But if you lose your job, and your income goes down, you will consume more Top Ramen, because it is inexpensive. Next we have to consider the substitution effect.  No matter type of good, the substitution effect will be negative as the price of that good goes up.  So if the price of
Image
Theory of Consumption - Indifference Curve Analysis - Substitution Effect Meaning:  When there is a change in the price of one commodity, and when the price of another commodity remains unchanged or constant, the income of the consumer must be changed in such a way that the consumer is neither better off nor worse off. He remains at the same old position. Under that circumstance, if there is a change in the consumption, that would be due to the Substitution Effect. Equilibrium:  We can find out the equilibrium position of the consumer in the following diagram. In the above diagram AB is the original price or budget line. T is the original equilibrium position. There is a fall in the price of X. So the new budget line is AC. To put the consumer at the same old position we draw another budget or price line DE, which will meet the indifference curve at the point T1. So the movement from T to T1 on the indifference curve IC shows the substitution effect. Here the consumer substi
Image
Indifference Curve Analysis - Income Effect New equilibrium position under Indifference Curve Analysis The equilibrium position of the consumer will be found out on the assumption that income of the consumer will remain constant. Now if there is any change either in the income of the consumer or prices of commodities, there will be a change in the equilibrium position. This can be explained under three heads. 1. Income Effect 2.  Price Effect 3.  Substitution Effect 1. Income effect: Meaning -  Where there is a change in the income of the consumer, but the prices of the commodities remain constant, there will be a change in consumption made by the consumer. This change in consumption is called the Income Effect. Equilibrium:  Under the income effect there will be a change in the equilibrium position of the consumer and that can be shown in the following diagram. In the diagram AB is the original price line. T1 is the original equilibrium position. As there is increase in income
Image
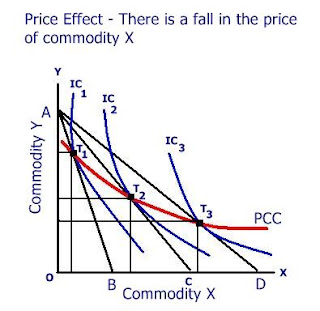
Indifference Curve Analysis - Price Effect Meaning:  When there is no change in the income of the consumer, no change in the price of one commodity, and there is a change in the price of another commodity, there will be a change in the consumption made by the consumer. This change in consumption is known as the Price Effect. Though money income does not increase, the real income increases, generating more purchasing power. Equilibrium position:  Under the Price Effect, there will be a change in the equilibrium position of the consumer. This can be shown in the following diagram. In this diagram  PCC is the Price Consumption Curve.  It is sloping downwards to the right. Any point on the Price Consumption Curve will indicate the equilibrium position of the consumer under the Price Effect. In this diagram  when the price of X falls, the consumer purchases more of X and less of Y. Shapes of Price Consumption Curve With a fall in the price of one commodity there will be some extra i

creativity in ads

The environment in which most companies compete requires marketers possess the ability to be creative.  While the example we use in the tutorial relates to creativity for developing new products, this marketing decision is by no means the only one that may frequently require new thinking.  In fact, most people would say the most creative part of marketing occurs with promotional decisions, such as developing a new advertising campaign. Yet, while we say marketers must be creative, it should be clear that the level of creativity may differ from one industry to another.  For instance, while technology marketers must fight off competition by constantly coming up with new ideas across their entire marketing mix (e.g. new products, new advertising, new pricing programs), marketers in less dynamic industries, such as those in many business-to-business markets (e.g., manufacturer of nuts and bolts), may be more limited to where new ideas are needed. Additionally, it is essential t

Change in Demand and Increase/Decrease in quantity demanded

Image
Movement and Shift in the Demand Curve Other things being equal, Demand of a commodity has a negative relationship with the price of the commodity (Change)Movement in Demand  – Movement in demand can be demonstrated as the change in quantity demanded  as a result of change in price . Movement is along the same demand curve. When price increases, demand decreases ( Increase/ Decrease)Shift in Demand  - changes in other relevant factors other than price cause a shift in demand, that is, a shift of the demand curve to the left or right. Such a shift results in a change in quantity supplied for a given price level. Shift of the demand is called increase or decrease in demand. If the change causes an increase in the quantity demanded at the same price, the demand curve would shift to the right and if the change causes an decrease in the quantity demanded at the same price, the supply curve would shift to the left. In the above curve,  D = initial demand curve S = initial supp